SEARCHING
Find out where the grant data comes from, and what years and philanthropies are included.
Information, tips and tricks for making your search more successful
Search
Grants – search grants based on their
stated purpose
Recipients – search all grants to
a particular recipient
Funders – search for organizations or
individuals that are funding grants
People – search for people who benefit
from grant funds
Website – search the website for specific
text
Advanced search – specifiy multiple
criteria
All-in-one search – search the website
and the database at the same time for specific text
MEDIA TRANSPARENCY
Sign-up for our newsletter
Only registered visitors are allowed to email content or post comments
Your help is essential to this website
|
AROUND THE WEB
Center for Economic and Policy Research
August 28, 2003
David Rosnick
In effort to denigrate US public education, Bush administration propaganda overstates the federal role in education funding, and understates real educational attainment by US students
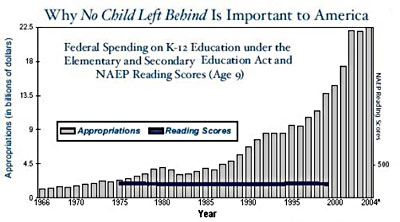
The Department of Education’s homepage prominently features a graph that appears to show a vast increase in federal spending on education over the last thirty five years, but no improvement whatsoever in student test scores. (http://www.ed.gov/) (Figure 1). The message seems clear.

(Figure 1: http://www.ed.gov/images/title-one.jpg)
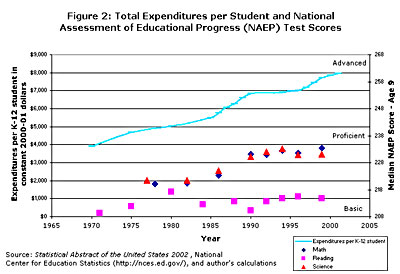
However, Figure 1 does not give an entirely accurate representation of the situation for several reasons. A better representation of the data might look like Figure 2 below.

There are several important differences between the two graphs.
* The generally accepted way to judge growth in expenditures is measured on an inflation-adjusted, per-capita basis. Whereas Figure 1 shows nominal growth in total federal expenditures, Figure 2 shows total K-12 expenditures adjusted both for inflation and for the number of students enrolled in K-12 schools...
* Figure 1 leads the viewer to believe that federal education appropriations are especially important for children’s achievement. However, these federal appropriations to elementary and secondary schools accounted for only 3.5% of all K-12 expenditures in 1999. Figure 2 shows all K-12 spending.
* Figure 1 provides little information as to what the test scores are measuring and whether this is the only measure of student achievement. The choice of scale is also misleading: 500 is the highest possible score, but it is placed near the bottom of the graph, making it seem low. In 1999, 90% of nine-year-olds scored between 173.4 and 285.4 on the reading test, but this is not evident from Figure 1. Figure 2 scales the test from scores of 208 (“Basic” 4th grade understanding) through 238 (“Proficient”) to 268 (“Advanced”).
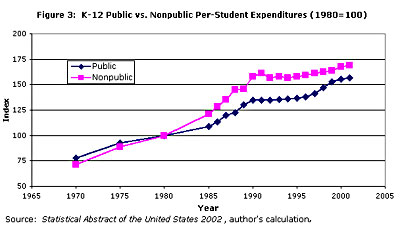
...From the standpoint of showing returns for increases spending, it is worth noting that private schools have not performed better. As seen in Figure 3 below, from 1970 to 2001, nonpublic school expenditures per K-12 student have grown at a 3.8% annual rate, compared to only 3.1% for public schools. However, the NAEP data from 1980 to 1999 indicates that average reading scores in nonpublic schools have not changed significantly, dropping one point over that time.
Figure 2 actually understates the improvement in scores made by minorities. In 1999, 68 percent of nine-year old Hispanics scored at least 200 on the mathematics NAEP exam, compared to only 54 percent in 1978. For African-American students, the difference is even greater: the percent of students scoring at least 200 rose from 42 percent in 1978 up to 63 in 1999.
Fortunately, all the necessary information is available to the public. From enrollment and expenditure data in the Statistical Abstract of the United States 2002 and test score data available at the National Center for Education Statistics an informative graphic may be produced.

Read the story >
|
|

